graph TD
    A((Start)) --> B[/Two Bread Slices, Peanut Butter, Jelly/]
    B --> C[Take 1st bread slice]
    C --> D[Spread peanut butter on it]
    D --> E[Spread jelly on it]
    E --> F[Take 2nd bread slice]
    F --> G[Put 2nd slice on top of the 1st]
    G --> H[/PB&J Sandwich/]
    H --> I((End))
3 Algorithm Development
In this chapter, we will explore the fundamental concepts of algorithm development, programming, and structured programming. We will discuss what algorithms are, how they are represented, and the building blocks of programming. We will also introduce the concept of pseudocode, flowcharts, and programming languages. Finally, we will walk through an example of developing an algorithm for making a peanut butter and jelly sandwich, starting from a simple sequence of steps and gradually adding complexity and structure to the algorithm.
3.1 What is an Algorithm?
An algorithm is a set of instructions or rules designed to solve a specific problem or perform a specific task. Algorithms are used in many areas of computer science, such as data processing, artificial intelligence, and machine learning. They are essential for developing software applications, analyzing data, and solving complex problems efficiently.
In Figure 3.1, we see an attempt to create an algorithm for making a sandwich. The algorithm is incomplete and lacks the necessary detail to be effective. To be useful, an algorithm must be detailed and precise, providing clear instructions for each step of the process.
3.2 What is a Program?
A program is a set of instructions (i.e., an algorithm) written in a particular programming language following its basic rules (i.e., syntax). Programs are designed to be easy for humans to read and write. The term code refers to the text of a program written in a programming language.
Once a program is written, it is translated into machine code (binary) that the computer can understand and execute.
3.3 Structured Programming
Programs are designed using common building blocks. These building blocks, known as programming constructs (or programming concepts), form the basis for all programs.
There are three basic building blocks to consider:
- Sequence is the order in which instructions1 occur and are processed.
- Selection determines which path a program takes when it is running.
- Iteration/Repetition is the repeated execution of a section of code when a program is running.
There are two types of iteration:
- Definite iteration (also known as count-controlled iteration)
- Indefinite iteration (also known as condition-controlled iteration)
All programs use one or more of these constructs. The longer and more complex the program, the more these constructs will be used repeatedly.
3.4 What is a Programming Language?
A programming language is a formal language that specifies a set of instructions that can be used to produce various kinds of output. Programming languages are used to create programs that implement specific algorithms. These programs can be used to perform a wide range of tasks, from simple calculations to complex data processing and analysis.
There are many different programming languages, each with its own syntax and rules. The choice of programming language depends on the task at hand, the target platform, and the programmer’s preferences and experience.
An index of the most popular programming languages can be found at the TIOBE Programming Community Index.
3.5 What is Pseudocode?
Pseudocode is a detailed yet informal description of a computer program that uses natural language to describe the steps involved in solving a problem. Pseudocode is not a programming language but rather a way to outline the logic of a program before writing the actual code.
3.6 Representing Algorithms with Flowcharts
A flowchart is a visual tool that represents the steps of a process or algorithm. It uses symbols and arrows to illustrate the flow of control within a program. Flowcharts are particularly useful for creating pseudocode, as they help to visualize the program’s logic before the actual coding begins.
In a flowchart, we typically use the following symbols:
- Start/End: Represents the beginning or conclusion of the process, traditionally shown as an oval. In Mermaid, we can simulate this using a rounded rectangle.
- Input/Output: Represents input or output operations, shown as a parallelogram.
- Process: Indicates a step where an action or process occurs, symbolized by a rectangle.
- Decision: Marks a point where the program decides between different paths based on a condition, illustrated by a diamond.
- Connector: Connects different parts of the flowchart, usually with an arrow.
- Module: Represents a subroutine or a separate module in the program, shown as a rectangle with a double border.
3.7 Example: A PB&J Sandwich Making Algorithm
In the following sections, we will explore how to represent the process of making a peanut butter and jelly sandwich using pseudocode and flowcharts. We will start with a simple algorithm and then enhance it by adding more complexity and detail.
NoteConvention for Referencing Algorithms
In this book, we will refer to algorithms as “listings” (e.g., Listing 1, Listing 2, etc.) because they are presented as a list of instructions.
Version 1. Making a PB&J Sandwich (Sequence)
Consider a simple algorithm for making a sandwich in its pseudocode form:
Notice that this algorithm is a sequence of steps that describe how to make a peanut butter and jelly sandwich. Each step is a simple instruction that can be followed to achieve the desired outcome.
Now, let’s represent this algorithm using a flowchart:
Version 2. Toast the Bread? (Selection)
Listing 3.1 can be improved by adding a decision point to check if the bread should be toasted before making the sandwich. If the bread is to be toasted, the algorithm will include the toasting step before proceeding to the next steps. Otherwise, the algorithm will skip the toasting step and proceed directly to making the sandwich.
graph TD
    A((Start)) --> B[/Two Bread Slices, Peanut Butter,<br>Jelly, Toast Preference/]
    B --> C{Toast Bread?}
    C -- Yes --> D[Toast the slices of bread]
    C -- No --> E[Take 1st bread slice]
    D --> E
    E --> F[Spread peanut butter on it]
    F --> G[Spread jelly on it]
    G --> H[Take 2nd bread slice]
    H --> I[Put 2nd slice on top of the 1st]
    I --> J[/PB&J Sandwich/]
    J --> K((End))
Version 3. Keeping an Even Spread (Condition-Controlled Repetition)
Listing 3.2 can be improved by adding a decision point to check if the spread is even on the bread slices. While the spread is not even (i.e., one side has more peanut butter or jelly than the other side), the algorithm will correct it before proceeding to the next step. Therefore, this correction step is condition-controlled, being repeated until the spread is even. In programming, this is known as a “loop” or “iteration.”
Input: Two Bread Slices, Peanut Butter, Jelly,
       Toast Preference (Yes/No)
Output: PB&J Sandwich
Start
   If toast preference is Yes
      Toast the slices of bread
   Take 1st bread slice
   Spread peanut butter on it
   While spread is uneven
      Correct the spread
   Spread jelly on it
   While spread is uneven
      Correct the spread
   Take 2nd bread slice
   Put 2nd slice on top of the 1st
End
graph TD
A((Start)) --> IN[/Two Bread Slices, Peanut Butter,<br>Jelly, Toast Preference/]
IN --> B{Toast Bread?}
B -- Yes --> C[Toast the slices of bread]
B -- No --> D[Take 1st bread slice]
C --> D
D --> E[Spread peanut butter on it]
E --> F{Is the PB<br>spread evenly?}
F -- No --> G[Correct the peanut<br>butter spread]
G --> E
F -- Yes --> H[Spread jelly<br>on it]
H --> I{Is the jelly<br>spread evenly?}
I -- No --> J[Correct the<br>jelly spread]
J --> H
I -- Yes --> K[Take 2nd bread slice]
K --> L[Put 2nd slice on top of the 1st]
L --> OUT[/PB&J Sandwich/]
OUT --> M((End))
Version 4. Making Multiple Sandwiches (Definite Iteration)
Listing 3.3 can be further enhanced by introducing definite iteration, allowing the algorithm to create multiple sandwiches based on the user’s input. Instead of making just one sandwich, the algorithm will now repeat the process for the number of sandwiches specified by the user. This involves looping a fixed number of times, which is known as definite iteration in programming.
In this version, the input will include the number of sandwiches to be made, and the entire sandwich-making process will be repeated until the specified number of sandwiches is created. The algorithm will ensure that each sandwich is made according to the steps in Version 3, including checking if the spread is even and toasting the bread if desired.
Input: Bread, Peanut Butter, Jelly,
       Toast Preference (Yes/No),
       Number of Sandwiches
Output: Specified Number of PB&J Sandwiches
Start
   Set Sandwich Count to 0
   While Sandwich Count < Number of Sandwiches
      If toast preference is Yes
         Toast the slices of bread
      Take a slice of bread
      Spread peanut butter on it
      While spread is uneven
         Correct the spread
      Spread jelly on it
      While spread is uneven
         Correct the spread
      Take 2nd bread slice
      Put 2nd slice on top of the 1st
      Increment Sandwich Count by 1
   End While
End
graph TD
A((Start)) --> IN[/Bread, Peanut Butter,<br>Jelly, Toast Preference,<br>Number of Sandwiches/]
IN --> B[Set <b>Sandwich Count</b> to 0]
B --> C{Is <b>Sandwich Count</b><br>lower than<br><b>Number of Sandwiches</b>?}
C -- Two Bread Slices, PB,<br>Jelly, Toast Preference --> D{Toast Bread?}
D -- Yes --> E[Toast the slices of bread]
E --> F
D -- No --> F[Take 1st bread slice]
F --> G[Spread peanut butter on it]
G --> H{Is the PB<br>spread evenly?}
H -- No --> I[Correct the peanut<br>butter spread]
I --> G
H -- Yes --> J[Spread jelly<br>on it]
J --> K{Is the jelly<br>spread evenly?}
K -- No --> L[Correct the<br>jelly spread]
L --> J
K -- Yes --> M[Take 2nd bread slice]
M --> N[Put 2nd slice on top of the 1st]
N --> O[Increment <b>Sandwich Count</b> by 1]
O --> C
C --No--> OUT[/PB&J Sandwiches/]
OUT --> P((End))
Version 5. Refactoring with Modular Algorithms
Listing 3.4 can be further refined by refactoring the code into modular components. Refactoring involves restructuring the code to improve its readability, maintainability, and efficiency. We can introduce separate algorithms for spreading an ingredient, making a single sandwich, and making multiple sandwiches. This modular approach promotes code reuse, simplifies maintenance, and makes the overall algorithm more structured and easier to understand.
In this version, the Spread Ingredient algorithm (Listing 3.5) is responsible for evenly spreading a given ingredient (e.g., peanut butter, jelly) on a single slice of bread. The Make a Sandwich algorithm (Listing 3.6) uses the Spread Ingredient algorithm to create a single PB&J sandwich. Finally, the Make Multiple Sandwiches algorithm (Listing 3.7) calls the Make a Sandwich algorithm repeatedly to create the desired number of sandwiches.
This modular design allows us to focus on specific tasks within the sandwich-making process, making the algorithm more flexible and maintainable.
Input: Two Bread Slices, Peanut Butter, Jelly
Output: PB&J Sandwich
Start
   If toast preference is Yes, toast the slices of bread.
   Take 1st bread slice
   Call the "Spread Ingredient" algorithm with Peanut Butter
   Call the "Spread Ingredient" algorithm with Jelly
   Take 2nd bread slice
   Place the second slice on top of the first slice
Endgraph TD
A((Start)) --> IN[/Bread, Peanut Butter,<br>Jelly, Toast Preference,<br>Number of Sandwiches/]
IN --> B[Set <b>Sandwich Count</b> to 0]
B --> C{Is <b>Sandwich Count</b><br>lower than<br><b>Number of Sandwiches</b>?}
C --Two Bread Slices, PB,<br>Jelly, Toast Preference--> J[[Call Algorithm<br><b>Make a Sandwich</b>]]
J --> K[Increment Sandwich Count]
K --> C
C --> OUT[/PB&J Sandwiches/]
OUT --> M((End))
subgraph "Spread Ingredient"
A2((Start)) --> IN2
IN2[/Bread Slice, Ingredient/] --> S1
S1[Apply the ingredient<br>to the bread slice] --> S2{Is the spread even?}
S2 -- No --> S3[Correct the spread]
S3 --> S2
S2 -- Yes --> OUT2[/Bread Slice with<br>Evenly Spread Ingredient/]
OUT2 --> S4((End))
end
subgraph "Make a Sandwich"
A1((Start)) --> IN1
IN1[/Bread, Peanut Butter, <br>Jelly, Toast Preference/] --> MS1{Toast Bread?}
MS1{Toast Bread?} --> MS2[Toast the slices<br>of bread]
MS2 --> MS3[Take 1st bread slice]
MS1 -- No --> MS3
MS3 --Bread Slice, PB --> MS4[[Call Algorithm<br><b>Spread Ingredient</b>]]
MS4 --Bread Slice with PB, Jelly --> MS5[[Call Algorithm<br><b>Spread Ingredient</b>]]
MS5 --> MS6[Take 2nd bread slice]
MS6 --> MS7[Put 2nd slice on top of the 1st]
MS7 --> OUT1[/PB&J Sandwich/]
OUT1 --> MS8((End))
end
3.8 Exercises
3.8.1 Choosing an Outfit Based on Weather
Imagine you are getting dressed in the morning, and you decide what to wear (raincoat, jacket, t-shirt) based on the weather (raining, cold, sunny). Write an algorithm that describes this decision-making process.
NoteSolution (Pseudocode)
NoteSolution (Flowchart)
3.8.2 Filling a Water Bottle with Cups of Water
Write an algorithm for filling a water bottle with cups of water. The algorithm should specify how many cups of water are needed to fill the bottle and how to pour the water into the bottle.
NoteSolution (Pseudocode)
NoteSolution (Flowchart)
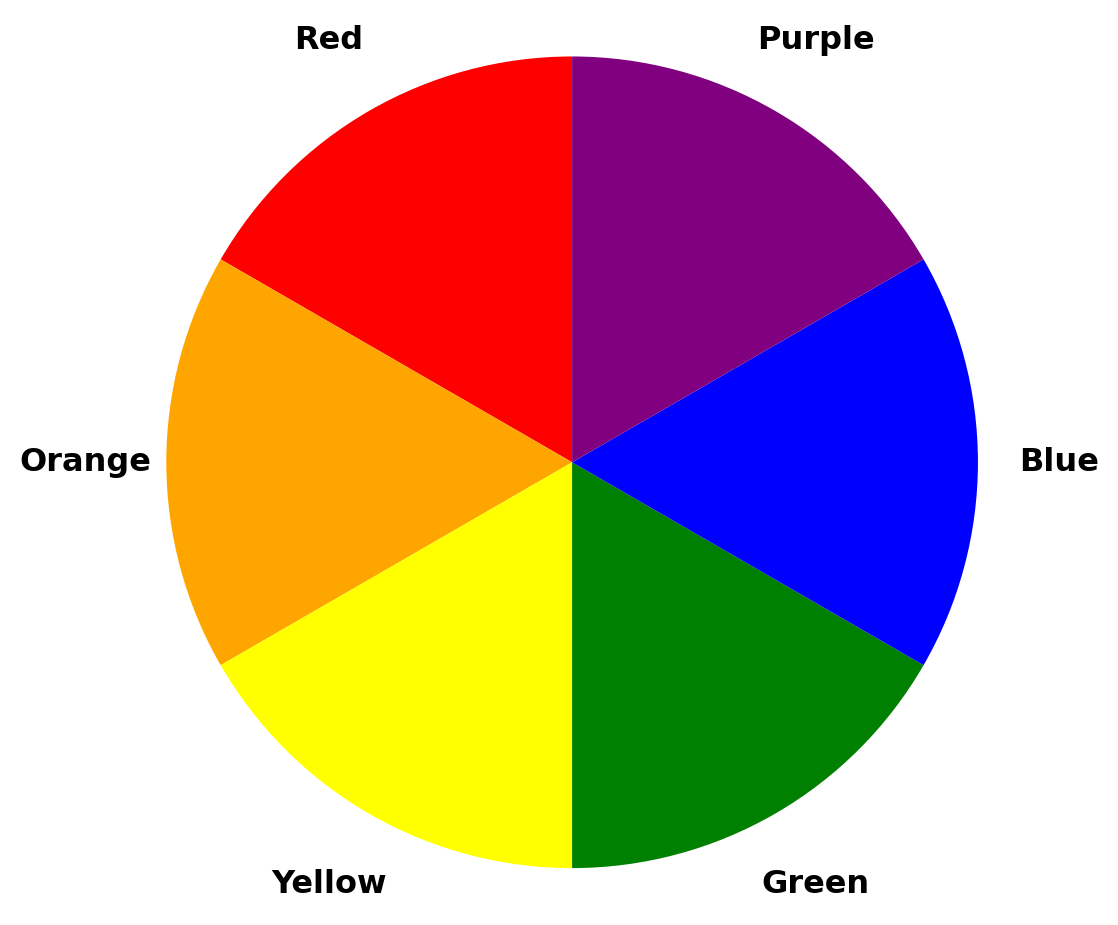
3.8.3 Color Theory
Background. Color Theory provides a framework to understand how colors relate to one another. The color wheel (see Figure 3.7) is a circular diagram that visually represents these relationships. The basic colors on the wheel are divided into primary and secondary colors:
- Primary Colors. The three basic colors that cannot be created by mixing other colors are:
- Red,
- Yellow, and
- Blue.
- Secondary Colors. Created by mixing two primary colors:
- Red + Yellow = Orange
- Yellow + Blue = Green
- Blue + Red = Purple
Problem. Write an algorithm to determine the secondary color produced when mixing two primary colors. The algorithm should specify the resulting color based on the input primary colors. If the input colors are not valid primary colors, the algorithm should output the error message “Invalid combination”.
Example Scenarios:
- Input: Red and Yellow
- Output: Orange
- Input: Yellow and Blue
- Output: Green
- Input: Blue and Red
- Output: Purple
- Input: Red and Blue
- Output: Purple
- Input: Red and Green
- Output: “Invalid combination”
NoteSolution (Pseudocode)
Input: color1, color2
Output: resulting color
Start
   if color1 is `Red` and color2 is `Yellow` or
      color1 is `Yellow` and color2 is `Red`
      output `Orange`

   Else If color1 is `Yellow` and color2 is `Blue` or
      color1 is `Blue` and color2 is `Yellow`
      output `Green`

   Else If color1 is `Blue` and color2 is `Red` or
      color1 is `Red` and color2 is `Blue`
      output `Purple`

   Else
      output "Invalid combination."
End
TipMutual Exclusivity of Conditions
Notice that we are using Else If statements. This means that the algorithm will check each condition sequentially. If the first condition is met, the algorithm will not check the subsequent conditions. The output is determined based on the first valid condition encountered. Therefore, the order of the conditions is crucial in this algorithm.
In the flowchart, notice that when a condition is met, the algorithm proceeds to the corresponding output without checking the other conditions.
NoteSolution (Flowchart)
3.8.4 Bulk or Cut Decision-Making
Motivation. In fitness and bodybuilding, deciding whether to bulk (gain muscle) or cut (lose fat) is crucial. This decision is based on several factors, including body fat (BF) percentage, muscle mass (MM), and fitness goals. There are many strategies to help individuals make this decision.
For example, according to “Should You Bulk or Cut?”, the decision-making process involves the following rules:
- For Men:
- Cut if body fat percentage is above 20%.
- Bulk if body fat percentage is below 15%.
- If body fat percentage is between 15% and 20%:
- Bulk if muscle mass is low.
- Cut if muscle mass is high.
- Maintain if muscle mass is moderate.
- For Women:
- Cut if body fat percentage is above 30%.
- Bulk if body fat percentage is below 25%.
- If body fat percentage is between 25% and 30%:
- Bulk if muscle mass is low.
- Cut if muscle mass is high.
- Maintain if muscle mass is moderate.
Problem. Write an algorithm that uses these guidelines to determine whether an individual should bulk or cut. The algorithm takes a person’s gender, body fat percentage, and muscle mass level (low, high, and moderate) as input and determines whether they should bulk, cut, or maintain.
Example Scenarios:
Input: Male, 22% body fat, moderate muscle mass
Output: Cut
Explanation: For men, body fat above 20% suggests cutting.Input: Female, 28% body fat, low muscle mass
Output: Bulk
Explanation: For women with body fat between 25% and 30%, and low muscle mass, bulking is recommended.Input: Male, 14% body fat, high muscle mass
Output: Bulk
Explanation: For men, body fat below 15% suggests bulking.Input: Female, 32% body fat, high muscle mass
Output: Cut
Explanation: For women, body fat above 30% suggests cutting.Input: Male, 16% body fat, moderate muscle mass
Output: Maintain
Explanation: For men, body fat between 15% and 20% and moderate muscle mass suggest maintaining.Input: Female, 26% body fat, moderate muscle mass
Output: Maintain
Explanation: For women, body fat between 25% and 30% and moderate muscle mass suggest maintaining.
NoteSolution (Pseudocode)
Input: gender, BF (bodyFatPercentage), MM (muscleMassLevel)
Output: bulk or cut decision
Start
   If gender is `male`
      If BF > 20
         Output: `Cut`
      Else If BF < 15
         Output: `Bulk`
      Else
         If MM is `low`
            Output: `Bulk`
         Else If MM is `high`
            Output: `Cut`
         Else
            Output: `Maintain`
   Else
      If BF > 30
         Output: `Cut`
      Else If BF < 25
         Output: `Bulk`
      Else
         If MM is `low`
            Output: `Bulk`
         Else If MM is `high`
            Output: `Cut`
         Else
            Output: `Maintain`
End
NoteSolution (Flowchart)
3.8.5 Warehouse Operation Management
Motivation. Company X is a multinational e-commerce corporation operating in two countries. The company has a vast customer base and a diverse product portfolio. To manage its warehouse operations efficiently, Company X uses a Traffic Light Model to monitor key performance indicators (KPIs) such as occupancy rate and fill rate.
Based on specific thresholds for occupancy and fill rates, the model categorizes the warehouse’s status into four levels:
- Green,
- Orange,
- Red, and
- Black.
By running this model, the Warehouse Operations team can take appropriate actions to maintain optimal warehouse performance and prevent operational issues. Table 3.1 provides an overview of the Traffic Light Model scenarios and the corresponding actions to be taken.
| Scenario | Metrics | Action to be taken |
|---|---|---|
| Black | Occupancy rate > 90% AND Fill rate > 35% | Refuse deliveries |
| Red | Occupancy rate > 85% AND Fill rate > 30% | Daily calls, Send suppliers to other warehouses, Decrease inbound volume, Weekly updates, Set up ‘rejectlist’ |
| Orange | Occupancy rate > 85% OR Fill rate > 30% | Validate operational situation, Analyze reasons, Relocate/consolidate, Check replenishment, Distribute roll containers, etc. |
| Green | Occupancy rate < 85% AND Fill rate < 30% | No actions needed |
Note
The Traffic Light Model is used in practice by a large e-commerce company. See details at Beekman, Yorick (2023). Accuracy improvement of warehouse capacity calculation using the bin packing problem.
Problem. Write an algorithm to implement the Traffic Light Model for warehouse management in Company X. The algorithm should take the occupancy rate (OR) and fill rate (FR) thresholds (see Table 3.1) as input and determine the appropriate traffic light color based on the predefined thresholds.
Examples:
Input: Occupancy Rate: 92%, Fill Rate: 36%
Output: Black
Explanation: Both the occupancy rate and fill rate exceed the thresholds for the Black scenario, indicating the most critical state.Input: Occupancy Rate: 87%, Fill Rate: 32%
Output: Red
Explanation: Both the occupancy rate and fill rate exceed the thresholds for the Red scenario, requiring several corrective actions.Input: Occupancy Rate: 88%, Fill Rate: 28%
Output: Orange
Explanation: The occupancy rate exceeds 85%, falling into the Orange category, which triggers preventive measures.Input: Occupancy Rate: 80%, Fill Rate: 25%
Output: Green
Explanation: Both the occupancy rate and fill rate are within the acceptable range, indicating normal operations with no need for intervention.
NoteSolution (Pseudocode)
NoteSolution (Flowchart)
3.8.6 Desktop Virus Guessing Game
Motivation. You want to create an annoying virus program that blocks the desktop screen and forces the user to play a guessing game to unlock the screen. The game involves guessing a random number between 1 and 1000. The user must keep guessing until they correctly identify the number, at which point the desktop screen is unblocked.
The program operates as follows:
- The program blocks the desktop screen and forces the user to guess a number.
- A random number between 1 and 1000 is generated using a
RandomNumberBetween(1, 1000)algorithm. This algorithm can be called to generate a random number within a specified range. For example,RandomNumberBetween(1, 1000)generates a random number between 1 and 1000, where 1 and 1000 are inclusive. - The user must input their guess, which is then checked against the random number.
- If the user guesses the correct number, the program unblocks the desktop and congratulates them.
- If the guess is incorrect, the number of trials increases, and a message prompts the user to “Try again.”
- The process repeats until the correct number is guessed.
Problem. Write pseudocode for the virus program that implements the guessing game to unlock the desktop screen. The algorithm should include the necessary steps to block the desktop, generate a random number, prompt the user for input, check the guess, and unblock the desktop upon a correct guess.
Extra questions:
- How would you implement the
RandomNumberBetween(1, 1000)algorithm? - How would you visualize the flow of the guessing game using a flowchart?
- Adjust the game to include hints for the user, such as “Higher” or “Lower,” to guide their guesses.
- Adjust the game so that each wrong guess result in a penalty, such as deleting a random file from the desktop.
- How would you implement the algorithm to read the user’s input to guarantee that it is a valid number within the specified range?
WarningPower of VBA
This guessing game can be implemented in VBA. Make sure you trust the source of the VBA code you run, as it can have harmful effects on your system.
NoteSolution (Pseudocode)
Input: User guesses a number
Output: Message indicating correct or incorrect guess

Start

   Set nOfTrials to 0
   Block the desktop screen
   Set randomNumber to the output of "RandomNumberBetween(1, 1000)" algorithm

   Loop indefinitely
      Display "Guess a number"
      Read user input
      Set userGuess to the user input

      If userGuess == randomNumber
         Display "Congratulations, you guessed correctly in nOfTrials trials"
         Unblock the desktop screen
         Exit the loop
      Else
         Increment nOfTrials by 1
         Display "Wrong guess. Try again."
End
NoteSolution (Flowchart)
3.8.7 Website Filtering System
Motivation. You are tasked by the government to develop a website filtering system that prioritizes the detection of VPN usage to prevent users from bypassing government restrictions. The system also checks whether websites are on a whitelist (approved websites) or a blacklist (banned websites) and logs suspicious activity. The system operates as follows:
- VPN Detection: If the system detects the use of a VPN, access is blocked and the user’s IP address is flagged for further investigation, regardless of whether the website is whitelisted or blacklisted.
- Whitelist: Websites on this list are allowed if no VPN is detected.
- Blacklist: Websites on this list are blocked if no VPN is detected.
- Logging: If a website is neither on the whitelist nor blacklist, access is allowed, but the visit is logged for future review.
Example Scenarios:
Input: website:
example.com, vpnStatus:False, in whitelist
Output: Access Allowed
Explanation: The website is in the whitelist, and no VPN is detected, so access is granted.Input: website:
bannedsite.com, vpnStatus:False, in blacklist
Output: Access Blocked
Explanation: The website is in the blacklist, so access is denied.Input: website:
randomsite.org, vpnStatus:False, not in either list
Output: Access Allowed, Website Logged for Review
Explanation: The website is not on any list, so access is allowed, but the visit is logged for review.Input: website:
randomsite.org, vpnStatus:True, not in either list
Output: Access Blocked and User Flagged
Explanation: The user is using a VPN, so access is blocked, and the user is flagged.Input: website:
example.com, vpnStatus:True, in whitelist
Output: Access Blocked and User Flagged
Explanation: The user is using a VPN, so access is blocked and flagged, even though the website is in the whitelist.Input: website:
bannedsite.com, vpnStatus:True, in blacklist
Output: Access Blocked and User Flagged
Explanation: The user is using a VPN, so access is blocked and flagged, even though the website is in the blacklist.
Problem. Write an algorithm that:
- Takes as input the website, whitelist, blacklist, vpnStatus (True/False), and userIPAddress.
- Determines whether access should be allowed, blocked, or logged.
- Prioritizes VPN detection and flags users attempting to bypass restrictions.
Extra Questions:
- How would you implement the algorithm to check if the website is in the whitelist or blacklist?
- How can you adjust the algorithm to check if the user’s IP address is on a watchlist for suspicious activity? For example, if the user has a history of accessing banned websites and attempts to access a banned website 3 times, they receive a fine.
TipIP Address and VPN
The user’s IP address can be used to identify their location and network information. It is a unique identifier assigned to each device connected to a network. Your online activity is completely known by your internet service provider (ISP), which commonly blocks access to certain websites like pirate sites dedicated to illegal downloads.
If you use a VPN, your IP address is masked, making it appear as if you are accessing the internet from a different location. A VPN is a Virtual Private Network that encrypts your internet connection and routes it through a server in a different location.
For example, if you are in the US and use a VPN server in the UK, websites will see your IP address as originating from the UK.
NoteSolution (Pseudocode)
Input: website, whitelist, blacklist, vpnStatus (True/False), userIPAddress
Output: Access decision
Start
   If vpnStatus is True
      Output: "Access Blocked and userIPAddress Flagged"
   Else If website is in whitelist
      Output: "Access Allowed"
   Else If website is in blacklist
      Output: "Access Blocked"
   Else
      Output: "Access Allowed, Website Logged for Review"
End
NoteSolution (Flowchart)
3.9 Multiple Choice Exercises
NoteSyntax for Accessing Elements in a List
For the following questions, the syntax for accessing the i-th element of the list L is L[i]. You may consider that the list L is indexed starting from 0.
If the length of the list is n, then:
- The first element of the list is
L[0]. - The second element of the list is
L[1]. - The third element of the list is
L[2]. - The last element of the list is
L[n-1].
3.9.1 Pass or Fail Algorithm
Which of the following correctly represents an algorithm that outputs “Pass” if a student’s score—labelled score—is 50 or above, and “Fail” otherwise? (Note: More than one flowchart may be correct.)
Select the correct flowchart(s) from the options below:
- Flowchart in Figure 3.8 (a)
- Flowchart in Figure 3.8 (b)
- Flowchart in Figure 3.8 (c)
- Flowchart in Figure 3.8 (d)
- Flowchart in Figure 3.8 (e)
graph LR
    A((Start)) --> B[/score/]
    B --> C{"Is score >= 50?"}
    C -- Yes --> D[/Pass/]
    C -- No --> E[/Fail/]
    D --> F((End))
    E --> F
graph LR
    A((Start)) --> B[/score/]
    B --> C{"Is score > 50?"}
    C -- Yes --> D[/Pass/]
    C -- No --> E[/Fail/]
    D --> F((End))
    E --> F
graph LR
    A((Start)) --> B[/score/]
    B --> C{"Is score < 50?"}
    C -- Yes --> D[/Fail/]
    C -- No --> E[/Pass/]
    D --> F((End))
    E --> F
graph LR
    A((Start)) --> B[/score/]
    B --> C{"Is score = 50?"}
    C -- Yes --> D[/Pass/]
    C -- No --> E[/Fail/]
    D --> F((End))
    E --> F
graph LR
    A((Start)) --> B[/score/]
    B --> C{"Is score >= 50?"}
    C -- No --> D[/Pass/]
    C -- Yes --> E[/Fail/]
    D --> F((End))
    E --> F
NoteSolution 3.9.1
Answer: Flowcharts in Figure 3.8 (a) and Figure 3.8 (c).
In the pass or fail algorithm, we check if a student’s score is 50 or above to determine if they pass or fail. Or, equivalently, we can check if the score is less than 50 to determine if the student fails. Therefore, options A and C are correct representations of the algorithm.
3.9.2 Linear Search Algorithm
Which of the following flowcharts correctly represents a linear search algorithm that searches for a specific number called target in a list entitled L? Given a list L and a number target, the algorithm should output “Number found” if target is in the list L, and “Number not found” otherwise.
For example:
- if
L = [1, 2, 3, 4, 5]andtarget = 3, the algorithm should output “Number found”. - if
L = [1, 2, 3, 4, 5]andtarget = 6, the algorithm should output “Number not found”.
You can assume that the list L is:
- Indexed starting from 0.
- Non empty.
Choose the correct flowchart from the options below:
- Flowchart in Figure 3.9 (a)
- Flowchart in Figure 3.9 (b)
- Flowchart in Figure 3.9 (c)
- Flowchart in Figure 3.9 (d)
graph LR
    A((Start)) --> IN[/L, target/]
    IN --> B["Set i to 0"]
    B --> C{"Is i<br>equal to<br>L length?"}
    C -- Yes --> D[/Number not found/]
    C -- No --> E{"Is L[i]<br>equal to<br>target?"}
    E -- Yes --> F[/Number found/]
    E -- No --> G[Increment i by 1]
    G --> C
    D --> H((End))
    F --> H
graph LR
    A((Start)) --> IN[/L, target/]
    IN --> B[Set i to 0]
    B --> C{"Is i<br>less than<br>L length?"}
    C -- No --> D[/Number found/]
    C -- Yes --> E{"Is L[i]<br>equal to<br>target?"}
    E -- Yes --> F[/Number found/]
    E -- No --> G[Increment i by 1]
    G --> C
    D --> H((End))
    F --> H
graph LR
    A((Start)) --> IN[/L, target/]
    IN --> B[Set i to 0]
    B --> C{"Is i<br>equal to 0?"}
    C -- Yes --> D[/Number not found/]
    C -- No --> E{"Is L[i]<br>equal to<br>target?"}
    E -- Yes --> F[/Number found/]
    E -- No --> G[Decrement i by 1]
    G --> C
    D --> H((End))
    F --> H
graph LR
    A((Start)) --> IN[/L, target/]
    IN --> B[Set i to 0]
    B --> C{"Is i<br>greater than 0?"}
    C -- No --> D[/Number not found/]
    C -- Yes --> E{"Is L[i]<br>equal to<br>target?"}
    E -- Yes --> F[/Number found/]
    E -- No --> G[Decrement i by 1]
    G --> C
    D --> H((End))
    F --> H
NoteSolution 3.9.2
Answer: Flowchart in Figure 3.9 (b).
In the linear search algorithm, we iterate through each element of the list and compare it with the target number. If the element is equal to the target, we output “Number found”; otherwise, we continue searching. Here’s a step-by-step breakdown of the algorithm using an example list L = [1, 2, 3, 4, 5] and a target number 3:
| Iteration | L | n (L Length) | i | L[i] | target | i < n? | L[i] = target? |
|---|---|---|---|---|---|---|---|
| 1 | 1,2,3,4,5 | 5 | 0 | 1 | 3 | 0 < 5? Yes! | 1 = 3? No! |
| 2 | 1,2,3,4,5 | 5 | 1 | 2 | 3 | 1 < 5? Yes! | 2 = 3? No! |
| 3 | 1,2,3,4,5 | 5 | 2 | 3 | 3 | 2 < 5? Yes! | 3 = 3? Yes! (Found!) |
In this example, the target number 3 is found in the list L = [1, 2, 3, 4, 5].
Steps of the Algorithm:
- Initial Setup:
L = [1, 2, 3, 4, 5]: List of numbers we are searching through.target = 3: Number we are looking for.n = 5: Length of the listL.i = 0: Start at the first element of the list.
- Iteration 1:
i = 0: Check the first element.L[i] = 1: The value at index 0 is 1.- Condition
i < n: Since0 < 5(True), continue. - Condition
L[i] = target:1 != 3(True), so move to the next element.
- Iteration 2:
i = 1: Check the next element.L[i] = 2: The value at index 1 is 2.- Condition
i < n: Since1 < 5(True), continue. - Condition
L[i] = target:2 != 3(True), so move to the next element.
- Iteration 3:
i = 2: Check the next element.L[i] = 3: The value at index 2 is 3.- Condition
i < n: Since2 < 5(True), continue. - Condition
L[i] = target:3 = 3(True), so the algorithm outputs “Number found”.
- Conclusion: The target number
3is found in the listL = [1, 2, 3, 4, 5]at index 2.
3.9.3 Finding the Max. Value in a List
Which of the following flowcharts correctly represents an algorithm for finding the maximum value—labelled max—in a list L? (Note: More than one flowchart may be correct.)
For example:
- if
L = [1, 2, 3, 4, 5], the algorithm should output5. - if
L = [5, 4, 3, 2, 1], the algorithm should output5. - if
L = [1, 3, 2, 5, 4], the algorithm should output5. - if
L = [5, 6], the algorithm should output6.
You can consider that the list L:
- Is non-empty and contains at least two elements.
- Is indexed starting from 0.
Choose the correct flowchart from the options below:
- Flowchart in Figure 3.10 (a)
- Flowchart in Figure 3.10 (b)
- Flowchart in Figure 3.10 (c)
- Flowchart in Figure 3.10 (d)
- Flowchart in Figure 3.10 (e)
graph LR
    A((Start)) --> IN[/L/]
    IN --> B[Set max to<br>first element]
    B --> C[Set i to 1]
    C --> D{"Is i<br>less than<br>L length?"}
    D -- No --> E[/Output max/]
    D -- Yes --> F{"Is L[i]<br>greater<br>than max?"}
    F -- Yes --> G["Set max<br>to L[i]"]
    F -- No --> H[Increment i by 1]
    G --> H
    H --> D
    E --> I((End))
graph LR
    A((Start)) --> IN[/L/]
    IN --> B[Set max to<br>first element]
    B --> C[Set i to 0]
    C --> D{"Is i<br>less than<br>L length?"}
    D -- No --> E[/Output max/]
    D -- Yes --> F{"Is L[i]<br>greater<br>than max?"}
    F -- Yes --> G["Set max<br>to L[i]"]
    F -- No --> H[Increment i by 1]
    G --> H
    H --> D
    E --> I((End))
graph LR
    A((Start)) --> IN[/L/]
    IN --> B[Set max to 0]
    B --> C[Set i to 1]
    C --> D{"Is i<br>greater than<br>L length?"}
    D -- Yes --> E[/Output max/]
    D -- No --> F{"Is L[i]<br>greater<br>than max?"}
    F -- Yes --> G["Set max<br>to L[i]"]
    F -- No --> H[Increment i by 1]
    G --> H
    H --> D
    E --> I((End))
graph LR
    A((Start)) --> IN[/L/]
    IN --> B[Set max to 0]
    B --> C[Set i to 0]
    C --> D{"Is i<br>less than<br>L length?"}
    D -- No --> E[/Output max/]
    D -- Yes --> F{"Is L[i]<br>less than<br>max?"}
    F -- Yes --> G["Set max to L[i]"]
    F -- No --> H[Increment i by 1]
    G --> H
    H --> D
    E --> I((End))
graph LR
    A((Start)) --> IN[/L/]
    IN --> B[Set max to<br>first element]
    B --> C[Set i to 1]
    C --> D{"Is i<br>equal to<br>L length?"}
    D -- Yes --> E[/Output max/]
    D -- No --> F{"Is L[i]<br>less than<br>max?"}
    F -- Yes --> G["Set max<br>to L[i]"]
    F -- No --> H[Increment i by 1]
    G --> H
    H --> D
    E --> I((End))
NoteSolution 3.9.3
Answer: Flowchart in Figure 3.10 (a) and Figure 3.10 (b).
In the linear search algorithm for finding the maximum value in a list, we iterate through each element of the list and compare it with the current maximum value. If the element is greater than the current maximum, we update the maximum value.
Here’s a step-by-step breakdown of the algorithm using an example list L = [1, 5, 3].
Considering Option A
If we consider the flowchart in option A, i is initialized to 1, and max (i.e., the first element of the list, L[0]) is set as the initial maximum value. Then, in iteration 1, we compare L[1] (i.e., 5) with max=L[0] (i.e., 1) and update max if L[1] is greater.
| Iteration | L | n (L Length) | i | L[i] | max | i < n? | L[i] > max? |
|---|---|---|---|---|---|---|---|
| 1 | 1,5,3 | 3 | 1 | 5 | 1 | 1 < 3? Yes! | 5 > 1? Yes! |
| 2 | 1,5,3 | 3 | 2 | 3 | 5 | 2 < 3? Yes! | 3 > 5? No! |
| 3 | 1,5,3 | 3 | 3 | 3 | 5 | 3 < 3? No! | - |
Considering Option B
If we consider flowchart B, the algorithm starts with i = 0 and max is set to the first element of the list. Then, max is equal to L[i]=L[0]=1.
Notice that the first comparison in this case is redundant (comparing L[0] with max=L[0]), but it doesn’t affect the final result.
This is why we have four iterations in option B, while option A has only three iterations.
| Iteration | L | n (L Length) | i | L[i] | max | i < n? | L[i] > max? |
|---|---|---|---|---|---|---|---|
| 1 | 1,5,3 | 3 | 0 | 1 | 1 | 0 < 3? Yes! | 1 > 1? No! |
| 2 | 1,5,3 | 3 | 1 | 5 | 1 | 1 < 3? Yes! | 5 > 1? Yes! |
| 3 | 1,5,3 | 3 | 2 | 3 | 5 | 2 < 3? Yes! | 3 > 5? No! |
| 4 | 1,5,3 | 3 | 3 | 3 | 5 | 3 < 3? No! | - |
TipFurther Analysis
- Do A and B algorithms work if the list is empty?
- Do A and B algorithms work if the list has only one element?
3.9.4 Iterative Sum Algorithm
Given the following flowchart, what will be the output if the input—labelled number—is 4?
graph LR
    A((Start)) --> B[/number/]
    B --> C[Set sum to 0]
    C --> D[Set i to 1]
    D --> E{"Is i<br>less than or<br>equal to<br>number?"}
    E -- Yes --> F{"Is i<br>an even<br>number?"}
    F -- Yes --> G[Add i<br>to the sum]
    F -- No --> H[Keep sum the same]
    G --> I[Increase i by one]
    E -- No --> J[/sum/]
    H --> I
    I --> E
    J --> K((End))
Choose the correct output:
- 4
- 6
- 8
- 10
- 12
NoteSolution 3.9.4
Answer: The output is 6.
In the iterative sum algorithm, we calculate the sum of all even numbers up to a given number. Here’s a step-by-step breakdown of the algorithm using an input of 4:
| Iteration | i | i <= 4? | i even? | Sum |
|---|---|---|---|---|
| 1 | 1 | Yes | No | 0 |
| 2 | 2 | Yes | Yes | 2 |
| 3 | 3 | Yes | No | 2 |
| 4 | 4 | Yes | Yes | 6 |
| 5 | 5 | No | - | 6 |
In this example, the sum of even numbers up to 4 is 6.
Steps of the Algorithm:
- Initial Setup:
number = 4: The input number.sum = 0: The initial sum.i = 1: The starting value for the loop.
- Iteration 1:
i = 1: Check if 1 is less than or equal to 4.- Since 1 is less than or equal to 4, proceed to the next step.
- Since 1 is not an even number, keep the sum the same.
- Iteration 2:
i = 2: Check if 2 is less than or equal to 4.- Since 2 is less than or equal to 4, proceed to the next step.
- Since 2 is an even number, add 2 to the sum.
- Updated sum:
sum = 0 + 2 = 2.
- Iteration 3:
i = 3: Check if 3 is less than or equal to 4.- Since 3 is less than or equal to 4, proceed to the next step.
- Since 3 is not an even number, keep the sum the same.
- Iteration 4:
i = 4: Check if 4 is less than or equal to 4.- Since 4 is less than or equal to 4, proceed to the next step.
- Since 4 is an even number, add 4 to the sum.
- Updated sum:
sum = 2 + 4 = 6.
- Iteration 5:
i = 5: Check if 5 is less than or equal to 4.- Since 5 is not less than or equal to 4, the loop ends.
- The algorithm outputs the sum, which is 6.
3.9.5 Algorithm X
Given the following flowchart, what will be the output if the input—labelled number—is 6?
graph TD
    A((Start)) --> B[/number/]
    B --> C{"Is number<br>less than or<br>equal to 1?"}
    C -- Yes --> D[/Return number/]
    C -- No --> E[Initialize<br>a to 0]
    E --> F[Initialize<br>b to 1]
    F --> S[Initialize<br>sum to 0]
    S --> G[Set i to 2]
    G --> H{Is i<br>less than or<br>equal to<br>number?}
    H -- Yes --> I[Set sum to<br>a + b]
    I --> J[Set a to b]
    J --> K[Set b to sum]
    K --> L[Increase i by 1]
    L --> H
    H -- No --> M[/b/]
    M --> N((End))
Choose the correct output:
- 5
- 8
- 13
- 21
- 34
NoteSolution 3.9.5
Answer: B) 8
Algorithm X is a Fibonacci sequence calculation algorithm that determines the n-th number in the Fibonacci sequence. Here’s a step-by-step breakdown of the algorithm using an input of 6:
| Iteration | number | a | b | i | i <= number? | sum (a + b) | a (updated) | b (updated) |
|---|---|---|---|---|---|---|---|---|
| 1 | 6 | 0 | 1 | 2 | yes | 1 | 1 | 1 |
| 2 | 6 | 1 | 1 | 3 | yes | 2 | 1 | 2 |
| 3 | 6 | 1 | 2 | 4 | yes | 3 | 2 | 3 |
| 4 | 6 | 2 | 3 | 5 | yes | 5 | 3 | 5 |
| 5 | 6 | 3 | 5 | 6 | yes | 8 | 5 | 8 |
| 6 | 6 | 5 | 8 | 7 | no | - | - | - |
A single action that can be performed by a computer processor (e.g., sum two numbers, assign value to variable).↩︎