Practice Exercises - Intro to TLM
Question 1
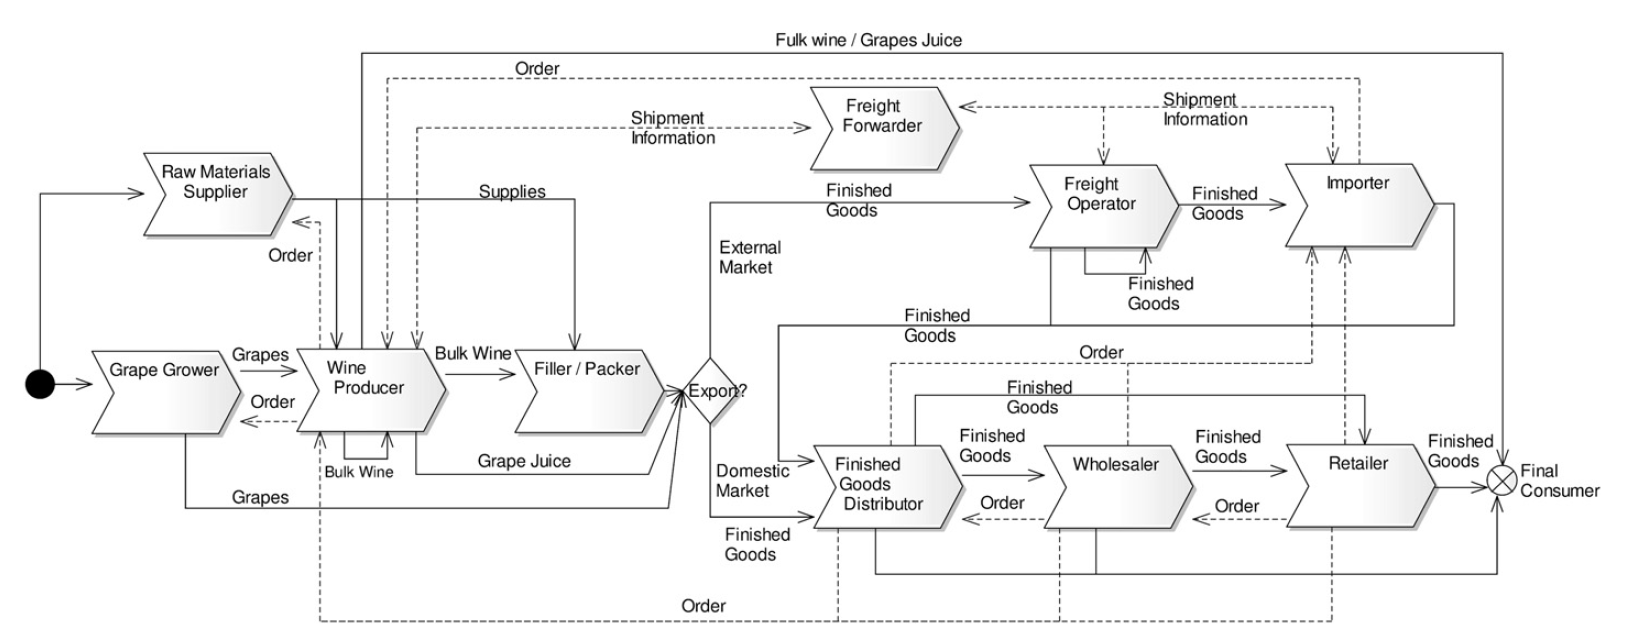
Check the supply chain presented in Figure 1 from in (Garcia, Fernanda A., et al. “A framework for measuring logistics performance in the wine industry.” International Journal of Production Economics 135.1 (2012): 284-298). Link on Canvas.
- What direct distribution channels do they have? (identify them)
- Classify the different logistics activities (components in the diagram) into Inbound Logistics, Internal Logistics, and Outbound Logistics.
- What are the flows considered in the supply chain map? What parts can be improved?
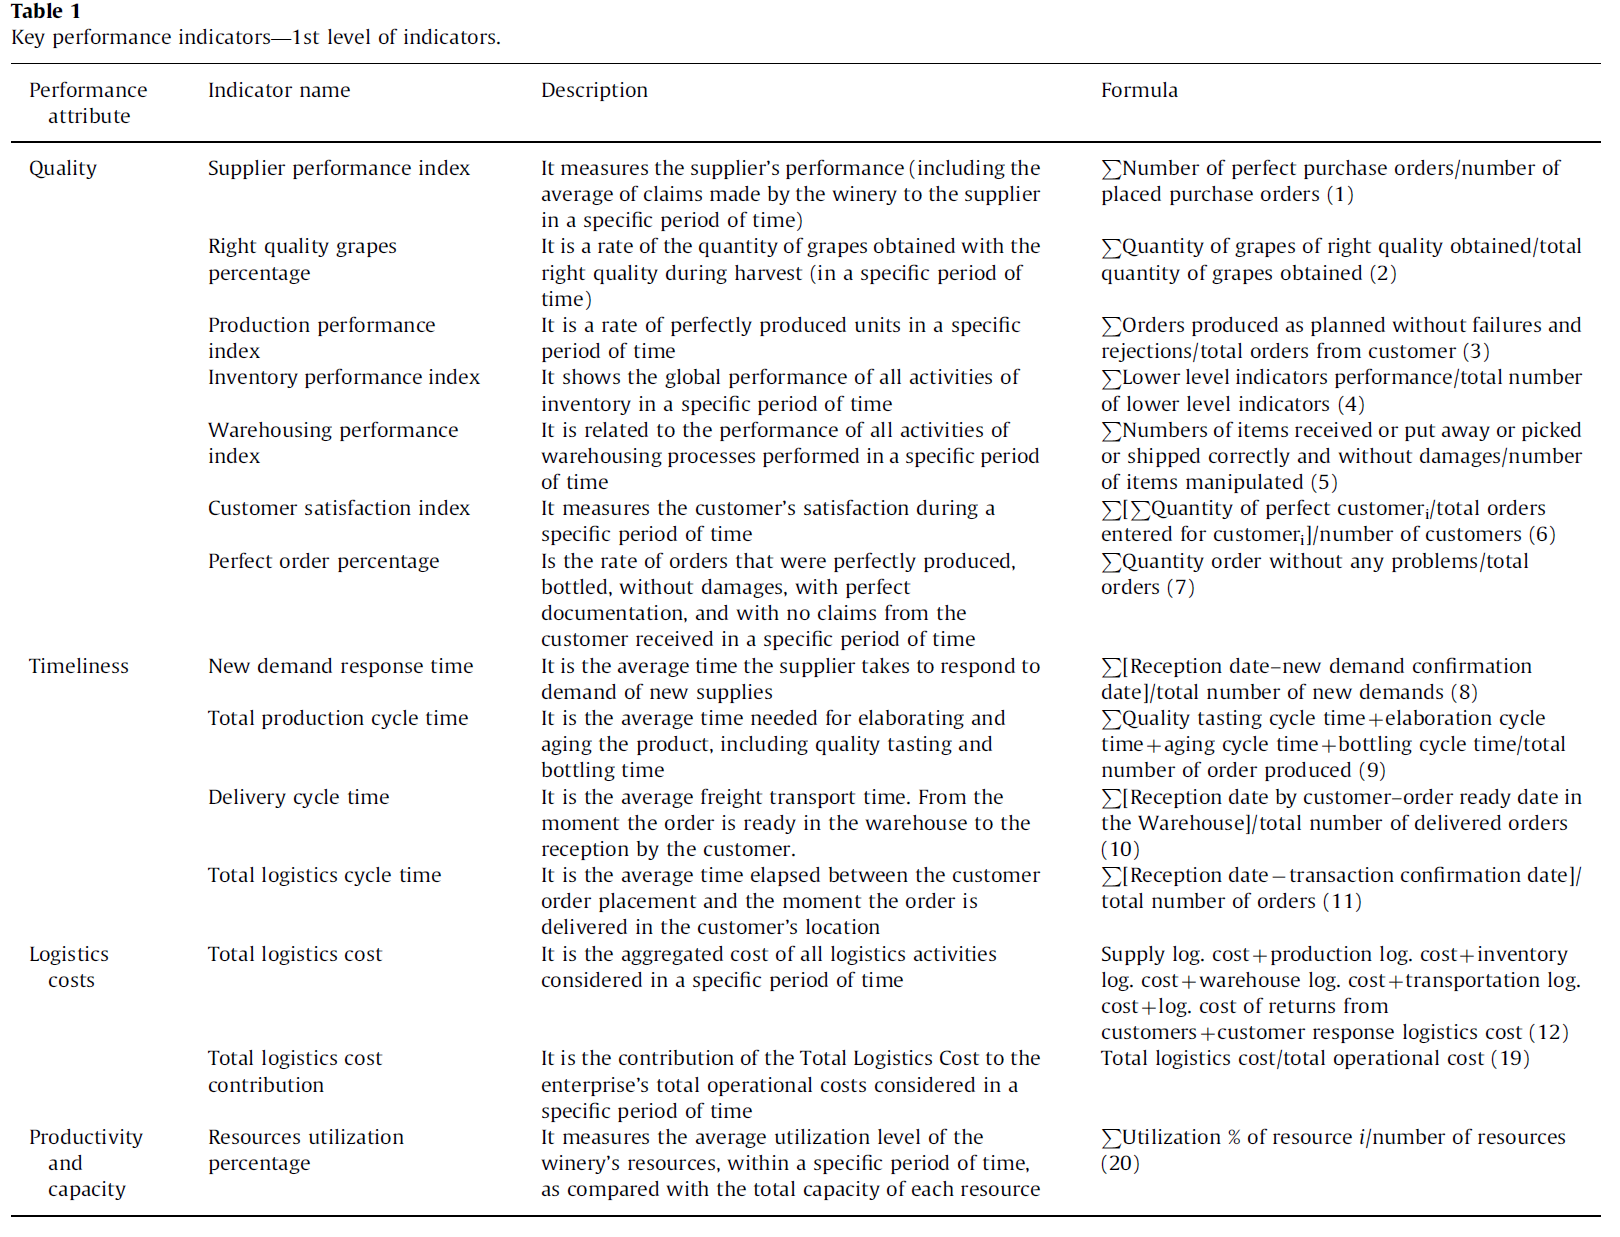
- If the company is exploring the possibility of directly delivering to customers through an online platform, which KPIs should the logistics management pay special attention to? (Figure 2), why?
Question 1 - Answer
- The distribution channels are those that directly connect the company with the consumer. Here, we can see four lines going to the final consumer. From the Retailer, Finished Goods Distributor, Wholesaler, and also from the Wine Producer (directly as bulk).
- We find (a) Inbound Logistics: Grape Grower, Raw Materials Supplier; (b) Internal Logistics: Wine Producer and Filler/Packer; and (c) Outbound Logistics: all remaining components.
- Information Flow (continuous lines) and Material/Product Flow (dotted lines). It can be improved by adding, for example, the Financial Flow and reverse logistics activities (e.g., bottle return) to the Product Flow.
- Using an online platform for distributing products often requires having accurate delivery times. The KPIs that might be useful are those related to the cycle time, especially with the “Total logistics cycle time”. Also, to avoid product returns due to failures, quality-based KPIs might be necessary. For instance, “Perfect order percentage” and “Customer satisfaction index” would be helpful. Those products with poor “Perfect order percentage” might produce problems and result in high reverse logistics costs.
Question 2
Ajt Solar is an Indian company that manufactures photovoltaic products. To control the logistics system, some critical logistics activities are monitored monthly. Three families of KPIs are considered: order processing, inventory management, and transport. The KPIs, their families, and the computing method used for each of them are shown in Table 1. The values of each computed KPI in the past \(15\) months are reported in Table 2.
| Family | Performance measure | Computing method |
|---|---|---|
| Order processing | Orders | Number of orders in a month/number of weekdays in a month |
| Complaints | Number of complaints a month | |
| Inventory | Stock values | Monthly inventory value |
| Transportation | Deliveries per journey | Average number of customers monthly served with a journey |
| Planned journeys | Monthly number of planned journeys/monthly number of journeys carried out |
| Period | Orders | Complaints | Stock values ($) | Deliveries per journey | Planned journeys |
|---|---|---|---|---|---|
| 1 | 154.26 | 21 | 470800 | 15.48 | 1.07 |
| 2 | 151.04 | 12 | 500800 | 36.76 | 0.97 |
| 3 | 161.23 | 16 | 533000 | 18.94 | 1.13 |
| 4 | 145.33 | 24 | 565900 | 33.07 | 1.14 |
| 5 | 158.66 | 14 | 567700 | 31.15 | 1.13 |
| 6 | 171.25 | 16 | 471900 | 40.37 | 1.10 |
| 7 | 98.66 | 31 | 522200 | 23.35 | 0.83 |
| 8 | 102.45 | 8 | 531000 | 14.33 | 1.00 |
| 9 | 134.74 | 12 | 509800 | 39.80 | 0.93 |
| 10 | 147.24 | 16 | 579700 | 18.37 | 1.20 |
| 11 | 133.54 | 21 | 548300 | 26.04 | 1.15 |
| 12 | 154.81 | 18 | 458700 | 30.10 | 1.00 |
| 13 | 148.82 | 20 | 542100 | 36.60 | 0.95 |
| 14 | 124.31 | 13 | 524500 | 26.52 | 1.11 |
| 15 | 164.03 | 11 | 567400 | 33.46 | 1.00 |
In the current month (with \(23\) working days), the company has recorded the following data:
- \(3,568\) orders,
- \(15\) complaints,
- \(\$560,400\) in stock value,
- \(24.25\) customers on average served on a journey,
- \(4,950\) planned journeys, and
- \(4,902\) journeys made.
Build a control panel (or a table) for monitoring the three identified KPI families. Show how the actions on the logistics system can change depending on the weights assigned to each KPI belonging to the first and third families and provide their corresponding values. For example:
- balanced strategy:
- family 1: \((0.5, 0.5)\)
- family 2 \((0.5, 0.5)\)
- service-oriented strategy
- family 1 \((0.3, 0.7)\)
- family 2 \((0.4, 0.6)\)
For normalizing KPIs, do not forget to use the formula: \[ y' = \frac{(y_t - a)(max - min)}{(b - a)} + min \]
Where \(y'\) is the normalized value, \(a\) and \(b\) are the minimum and maximum values of \(y_{t}\); \(min\) and \(max\) correspond to the interval where we want the observations to be. In this case, between 1 and 10.
Question 2 - Answer
In this exercise, you have to generate month 16 considering Table 1.18. Once that is done, you normalize the values of those KPIs following the formulas above and make the multiplication using the weights provided in Family 1.
In this case, for month 16, the orders are calculated as 3568/23, Complaints 15, Stock values 560400, deliveries per journey 24.25, and planned journey 4950/4902.
After adding that row to Table 1.19, you have to normalize it (using the provided formula). For instance, for the orders, we have a=98.66, b=171.25, min=1, and max=10. The output of that formula is the normalized KPI. This must be done for all KPIs.
Finally, we see that “order processing” is a family of KPIs composed of orders and complaints, so the normalized values are aggregated as follows:
KPI_processing = KPI_orders * 0.5 + KPI_complaints * 0.5This allows us to understand how the company’s order-processing operations perform.
Solutions:
Question 3
Your company is currently facing a driver shortage, resulting in only two trucks being available for dispatching. Each truck has a capacity of 1000 kg, and the management department has specified that they must be fully utilized. The following table shows the company’s customers and the annual revenue generated from each.
| Customer id | Order quantity (last year) |
Revenue |
|---|---|---|
| 1 | 1540 | 21000 |
| 2 | 1510 | 12000 |
| 3 | 1610 | 16000 |
| 4 | 1450 | 24000 |
| 5 | 1580 | 14000 |
| 6 | 1710 | 16000 |
| 7 | 980 | 31000 |
| 8 | 1020 | 8000 |
| 9 | 1340 | 12000 |
| 10 | 1470 | 16000 |
| 11 | 1330 | 21000 |
| 12 | 1540 | 18000 |
| 13 | 1480 | 20000 |
| 14 | 1240 | 13000 |
| 15 | 1640 | 11000 |
Which customers will you be servicing for next-day delivery, using a distribution strategy that considers the previous information? The table below displays the orders that need to be delivered. It is important to note that each order to a customer must be complete; for example, if customer 1 is to be served, all 354 kg must be delivered in that visit.
| Customer id | Order (kg) |
|---|---|
| 1 | 354 |
| 2 | 251 |
| 3 | 461 |
| 4 | 245 |
| 5 | 258 |
| 6 | 371 |
| 7 | 198 |
| 8 | 302 |
| 9 | 534 |
| 10 | 247 |
| 11 | 333 |
| 12 | 554 |
| 13 | 248 |
| 14 | 324 |
| 15 | 464 |
Question 3 - Answer
To decide which customers we are going to serve (given the company’s logistics limitation), you can make use of historical data and apply the ABC analysis (ordering the list of customers in non-increasing values and successively selecting the customers in the resulting order, up to a predetermined cumulated value). You have to do as follows:
| Customer | Order quantity (last year) |
Order revenue | Cumulated annual revenue |
Type of customer |
|---|---|---|---|---|
| 7 | 980 | 31000 | 12.25 | A |
| 4 | 1450 | 24000 | 21.74 | A |
| 1 | 1540 | 21000 | 30.04 | A |
| 11 | 1330 | 21000 | 38.34 | A |
| 13 | 1480 | 20000 | 46.25 | A |
| 12 | 1540 | 18000 | 53.36 | A |
| 3 | 1610 | 16000 | 59.68 | A |
| 6 | 1710 | 16000 | 66.01 | A |
| 10 | 1470 | 16000 | 72.33 | A |
| 5 | 1580 | 14000 | 77.87 | A |
| 14 | 1240 | 13000 | 83.00 | B |
| 2 | 1510 | 12000 | 87.75 | B |
| 9 | 1340 | 12000 | 92.49 | B |
| 15 | 1640 | 11000 | 96.84 | C |
| 8 | 1020 | 8000 | 100.00 | C |
| Total | 21440 | 253000 |
From here, you see you will first serve customer 7, then 4, then 1, and so on until there is no remaining vehicle capacity (we have a limited capacity of 2000kg, 1000kg/truck).
Question 4
Consider the reverse logistics paper (provided on Canvas -> Lecture 1).
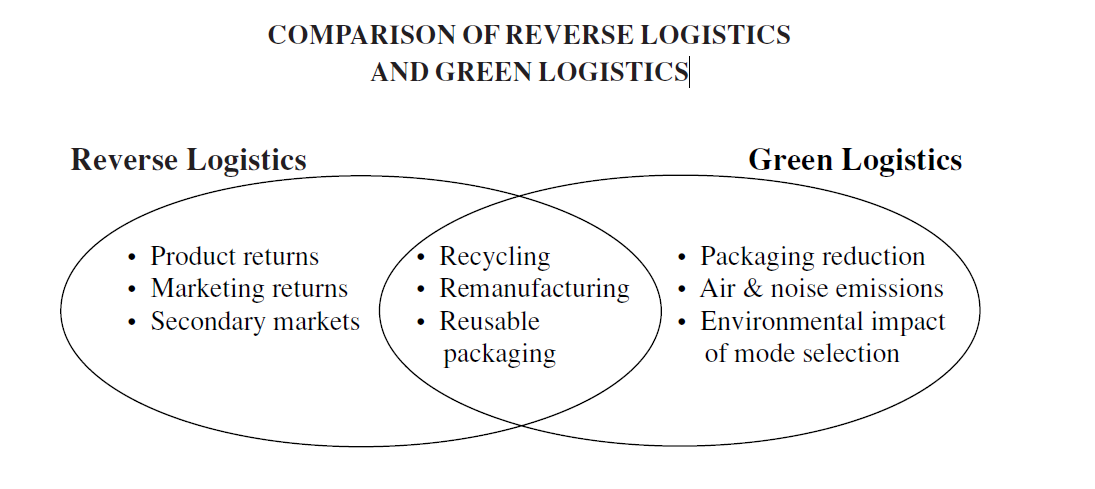
- What is reverse logistics? For what is it developed?
- What activities does reverse logistics share with green logistics?
- What are the two main barriers to applying reverse logistics? Describe them.
- Describe the most common reasons why a product or packaging may be sent backwards by supply chain partners or end users.
Question 4 - Answer
Reverse logistics is “the process of planning, implementing, and controlling the efficient, cost effective flow of raw materials, in-process inventory, finished goods, and related information from the point of consumption to the point of origin”. It is developed with the “purpose of recapturing or creating value or proper disposal”.
Reverse logistics and green logistics can be equally applied to Recycling, Remanufacturing, and Reusable packaging.
The top two barriers to implementing reverse logistics solutions are:
- Low Priority and Investment: About 40% of respondents do not prioritize reverse logistics, leading to insufficient investment in improving systems and capabilities. Some view it as unimportant, though this attitude is gradually changing due to its impact on industries like publishing.
- Company Policies: Many companies have policies that hinder effective reverse logistics, such as destroying all returns instead of reselling them profitably. About 35% of respondents believe these policies negatively impact reverse logistics management, but there’s a trend toward eliminating overly restrictive policies.
Common reasons why an item (product or packaging) may be sent backwards by supply chain partners or end users include:
- Products
- Supply Chain Partners
- Stock balancing returns
- Marketing returns
- End of life/season
- End Users
- Defective/unwanted products
- Warranty returns
- Recalls
- Environmental disposal issues
- Supply Chain Partners
- Packaging
- Supply Chain Partners
- Reusable totes
- Multi-trip packaging
- Disposal requirements
- End Users
- Reuse
- Recycling
- Disposal restrictions
- Supply Chain Partners
- Products
Question 5
Consider the supply chain involved when a customer orders a book from Amazon. Identify the push/pull boundary and two processes each in the push/pull phases.
Question 5 - Answer
The push/pull boundary is where demand switches from reactive (pull) to speculative (push) production. Amazon’s push/pull boundary lies primarily at the interface between stocked inventory (at fulfillment centers) and customer orders.
- Push Phase: This includes all the processes leading up to stocking products in Amazon’s fulfillment centers, such as demand forecasting, procurement of products, receiving as stocking inventory, and inventory management.
- Pull Phase: Once a customer orders through Amazon’s platform (the retailer), the supply chain shifts to the pull phase. The ordered product is then retrieved from the fulfillment center and shipped to the customer. Processes include order processing, picking and packing, shipping, and customer service and returns.
Question 6
What are the typical supply chain cycles and stages? Give examples of activities pertaining to each cycle.
Question 6 - Answer
Supply chain processes are typically organized into four key process cycles, which interconnect five fundamental stages of the supply chain: suppliers, manufacturers, distributors, retailers, and customers.
- Customer Order Cycle:
- Function: This cycle connects the customer with the retailer.
- Activities: It involves the customer browsing, selecting, and ordering products.
- Example: In an online retail context, like Amazon, this would include the entire process from when a customer searches for a product on the website to when they place an order.
- Replenishment Cycle:
- Function: Connects the retailer with the distributor.
- Activities: It involves restocking inventory at retail outlets or fulfillment centers.
- Example: A retailer like Amazon uses predictive analytics to forecast demand and determine optimal inventory levels in various fulfillment centers, ensuring products are available for customer orders.
- Manufacturing Cycle:
- Function: Connects the distributor with the manufacturer.
- Activities: It involves the production of goods based on demand signals received from distributors.
- Example: For book distribution, this might involve a distributor signaling a publisher or a printing company to produce more copies of a book in response to retail demand.
- Procurement Cycle:
- Function: Connects the manufacturer with the supplier.
- Activities: It involves sourcing raw materials and components required for manufacturing products.
- Example: In book manufacturing, this would include procuring paper, ink, and other materials needed to print and assemble books.